Brier Score
The Brier Score is a performance metric used to evaluate the accuracy of probabilistic forecasts. Originally developed for weather forecasting, it has become a standard tool in machine learning to assess how well a model’s predicted probabilities match actual outcomes.
1. Calculation and Formula
The Brier score is essentially the mean squared error of predicted distributions compared to the true one-hot encoded labels.
- Multiclass Formula: For N examples and C classes:
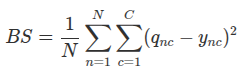
where qnc is the predicted probability for class c and ync is the actual indicator (1 if class c is true, 0 otherwise).
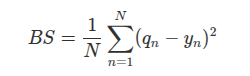
- Binary Formula: In the common case of two classes, the formula is often simplified and divided by two to keep the range between 0 and 1:
2. How to Interpret the Brier Score
-
Value Range: The score ranges from 0 to 1.
-
Optimal Value: A score of 0 indicates a perfect forecast, where the model assigns 100% probability to the correct class every time.
-
Worse Value: A higher score indicates greater error. For a binary problem, a model that consistently predicts a 50/50 chance for every outcome would result in a Brier Score of 0.25 (assuming classes are balanced).
3. Key Property: Proper Scoring Rule
The Brier score is a proper scoring rule, which is a vital mathematical property for any metric assessing uncertainty.
-
Truth-Telling: A rule is "proper" if the expected loss is minimized if and only if the model predicts the true underlying probability distribution of the data.
-
Calibration: Maximizing or minimizing a proper scoring rule (like Brier score or log loss) encourages the model to be well-calibrated, meaning its predicted 70% probability actually happens 70% of the time in the real world.
4. Comparison to Log Loss (Cross-Entropy)
While both are proper scoring rules, they behave differently:
-
Sensitivity to Extremes: Log loss is highly sensitive to confident incorrect predictions (e.g., predicting 0.0001% for an event that actually happens) because the logarithm of a near-zero value approaches infinity.
-
Robustness: Because it is based on squared error, the Brier score is less sensitive to errors in extremely rare or extremely common classes. It provides a more stable evaluation when dealing with "tail" probabilities.
5. Advanced Variant: Brier Skill Score (BSS)
Because absolute Brier score values can be difficult to interpret across different datasets, practitioners often use the Brier Skill Score to measure relative performance against a baseline.
-
Formula: BSS=1−BS/BSref
-
Reference Model (BSref): This is usually the Brier score of a simple baseline, such as the long-run average frequency of the class (called "in-sample climatology" in meteorology).
-
Interpretation:
- 1.0: Perfect improvement over the baseline.
- 0: No improvement over the baseline.
- Negative Values: The model is performing worse than simple frequency-based guessing.
6. Applications in Generative Modeling
Beyond simple classification, the Brier scoring rule has been used as an objective function to train generative models like Generative Adversarial Networks (specifically LS-GAN). In this context, minimizing the Brier score is mathematically linked to minimizing the Pearson χ2 divergence between the generated and real data distributions.