Confusion Matrix
A confusion matrix is a table used to summarize and assess the success of a classification model by comparing its predicted labels against actual ground truth labels. It provides a detailed breakdown of how many instances the model classified correctly and, crucially, which specific classes it confused with others.
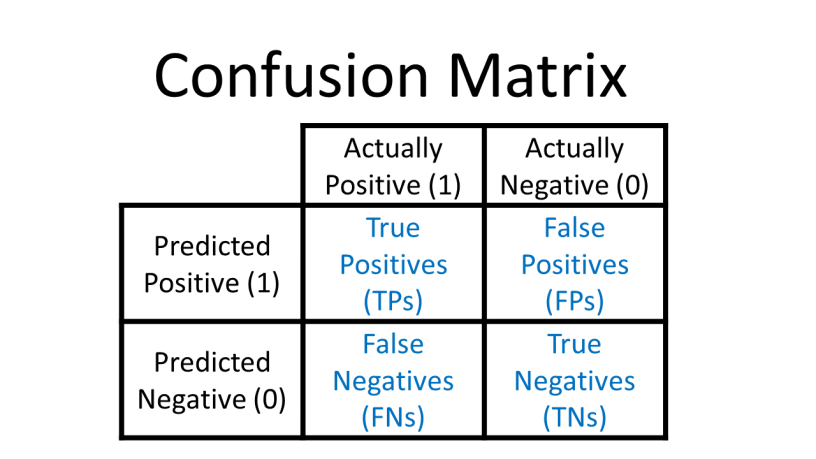
1. Structure and Building a Confusion Matrix
In a binary classification problem (where there are two classes, often designated as positive and negative), the confusion matrix is a 2x2 table. While conventions can vary slightly, most common implementations (such as scikit-learn) use rows to represent actual classes and columns to represent predicted classes. (Note: some sources reverse this, using columns for ground truth).
The matrix is built by counting model outcomes in four categories:
- True Positives (TP): Instances correctly predicted as the positive class.
- True Negatives (TN): Instances correctly predicted as the negative class.
- False Positives (FP): Instances incorrectly predicted as positive (also known as a Type I error or "fallout").
- False Negatives (FN): Instances incorrectly predicted as negative (also known as a Type II error or "miss").
For multiclass classification, the matrix expands to a K×K grid for K classes. For example, in a 10-digit classification task, the matrix would be 10x10, with the main diagonal representing correctly identified digits.
2. How to Interpret the Matrix
- The Main Diagonal: Entries on the main diagonal (from top-left to bottom-right) correspond to correct classifications. A "perfect" classifier would have nonzero values only on this diagonal and zeros everywhere else.
- Off-Diagonal Entries: These represent errors. Analyzing these help determine mistake patterns. For instance, a model might frequently predict "mouse" when the actual label is "rat," suggesting a need for more distinct features or more training examples for those specific species.
- Error Analysis: By dividing the values in the matrix by the number of images in each class, you can compare error rates rather than absolute numbers, which prevents abundant classes from looking "worse" simply due to their volume.